
NGC7280 Observation Details
NGC7280 Daily Motion
NGC7280 will rise at 04:38, during twilight, and will ascend to 20° by the time twilight ends at 06:22.NGC7280 will become visible in April, 21. After being too close to the Sun to observe, it will reappear in the night sky. Starting from April, 21, NGC7280 can be seen again, providing a good opportunity for observation.
NGC7280 Visibility Timetable on March 28
NGC7280 Rise and Set Timetable
| Time | Elevation | |
| Moon Rise, 5.9% illuminated | 06:29 | 20° |
| NGC7280 transit | 11:37 | 66° |
| Moon Set | 17:57 | 6° |
| NGC7280 set | 18:32 | |
| Astrosession begin | 21:23 | -26° |
| NGC7280 rise | 04:38 | |
| Astrosession end | 05:50 | 13° |
| Civil sunrise | 06:54 | 26° |
| Sunrise | 07:23 | 31° |
Track NGC7280 Position Throughout the Night
← Fri, 28 March 2025 →
| Time | |
| Altitude | |
| Azimuth |
Shift the map to change the time and observe NGC7280 changing position in the night sky.
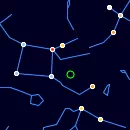
Finder Chart for NGC7280
Double-click to unlock the map.
| Object name | NGC7280 |
| Field of view | |
| Limiting magnitude | |
| NGC7280 coordinates | 22.44099, 16.14822 |
| Center coordinates | 22.44099, 16.14822 |
NGC7280 Passage Through Night
Double-click to unlock the map.
Current position of NGC7280
| Time | 03:48 |
| Latitude | 39.9625 |
| Longitude | -83.0061 |
| NGC7280 elevation | -9° |
| NGC7280 Azimuth | -60° |
Here you can see the current position of the NGC7280 on the map, as well as its positions for rise and set. This tool allows you to track the NGC7280's movement throughout the night, providing you with accurate and up-to-date information.
Annual motion of NGC7280
| Date | Sat, 29 March 2025 |
| Twighlight start | 21:20 |
| Twighlight end | 05:43 |
| Twighlight duration | 8h 23m |
| Rise | 04:34 |
| Set | 18:24 |
| Elevation at transit | 66° |
| Transit time | 11:29 |
| Equatorial coordinates | RA: 22h 26m 27s", Dec: 16° 08' 53s |
| Magnitude | 12 |
| Constellation | Pegasus |
The graph illustrates the annual visibility pattern of a NGC7280, providing a comprehensive overview of its daily appearances and transit times throughout the year.
The graph is structured with the vertical axis showing the hours of the day, ranging from 12 AM to 12 AM the next day, while the horizontal axis spans each day of the year.
The reddish shaded area indicates the periods when the NGC7280 is above the horizon, visible to observers. The white line marks the times when the celestial object reaches its highest point in the sky each day, known as the transit.
Data Credits
The nebulae information on this page is sourced from the OpenNGC project, developed by Matteo Verga. OpenNGC provides detailed data on the NGC catalog, which is a valuable resource for exploring deep-sky objects such as nebulae.
For more details or to contribute to OpenNGC, visit the official GitHub repository: OpenNGC on GitHub.