
Solar Spectrum: Rise, Set, and Space Weather
Sun Events Timetable
| Sunset/Sunrise | 18:22 | 04:06 | ||||||
| Civil Twighlight | 18:53 | 03:35 | ||||||
| Nautical Twighlight | 19:29 | 02:59 | ||||||
| Astronomical Night | 20:09 | 02:19 |
| Elevation at transit | 73° |
| Transit time | 11:14 |
| Distance to Earth | 1.0159 AU (151,976,477 km) |
Sun
 Last update: Wed, 22 July 2026, 07:00
Current Sunspot and Flare Activity
The Sun currently displays 4 active sunspot regions visible from Earth, varying in size and magnetic complexity. This includes 1 newly detected sunspot region (4494) in the past 24 hours.The largest sunspot is AR 4493, classified as Dkc, covering 300 millionths of the solar hemisphere (MSH), and containing 30 individual spots.
Today's flare activity includes:
- M3.4-class flare from AR 14493 at Mon, 20 July 2026 13:15
- M1.9-class flare from AR 14493 at Tue, 21 July 2026 08:16
- M1.1-class flare from AR 14493 at Mon, 20 July 2026 10:15
Recent Sunspots
4494
Sunspot Region
Spot count:
1
Area:
30
Coordinates:
S04E66
Class:
Hsx
Magnetic Class:
A
AR 4494 is an Hsx-class sunspot group that emerged on 2026-07-20 19:28. It covers 30 millionths of the solar disk and contains 1 spot.
Explore detailed sunspot data, including all active regions, classifications, and flare history
Real-Time Solar Imaging
The data used in these images are provided by the Solar Dynamics Observatory (SDO). The SDO is a mission of NASA’s Living With a Star (LWS) Program, designed to understand the causes of solar variability and its impacts on Earth. The Atmospheric Imaging Assembly (AIA) and Helioseismic and Magnetic Imager (HMI) instruments onboard SDO deliver high-resolution, real-time images of the sun in multiple wavelengths, which are essential for studying solar phenomena and predicting space weather. We gratefully acknowledge the efforts of the entire SDO team and NASA for making these invaluable data available to the public.
Magnetogram

HMI (Helioseismic and Magnetic Imager) magnetogram photos depict the sun's magnetic field strength and direction on its surface. These images, taken by the HMI instrument on the Solar Dynamics Observatory (SDO) satellite, reveal the intricate magnetic structures, including sunspots and active regions.
Intensitygram

HMI intensitygram photos display the sun's surface in visible light, highlighting features such as sunspots, granulation, and solar faculae. These images, captured by the HMI instrument aboard the Solar Dynamics Observatory (SDO), provide a detailed view of the sun's photosphere, allowing for the observation of sunspot development and movement.
Solar Magnetism: Coronal Loop Dynamics

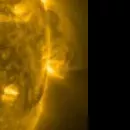
These photos capture the sun in the 171 angstrom wavelength, highlighting the solar corona and upper transition region. These images, taken by the Atmospheric Imaging Assembly (AIA) on the Solar Dynamics Observatory (SDO), reveal the structure of the sun's outer atmosphere and trace the magnetic field lines extending into space. The 171 Å wavelength is particularly effective at showing the million-degree plasma loops that emerge from the sun's surface.
Active Regions, Flares, and Coronal Holes

AIA 193 Å photos capture the sun in the 193 angstrom wavelength, focusing on both the hot corona and the cooler material of solar flares and coronal mass ejections (CMEs). These images reveal the sun's outer atmosphere and coronal holes, which are regions where the solar wind escapes into space. The 193 Å wavelength is particularly useful for observing the high-temperature plasma that forms in the corona, typically around 1.25 million Kelvin, and during solar flares, it can reach up to 20 million Kelvin.
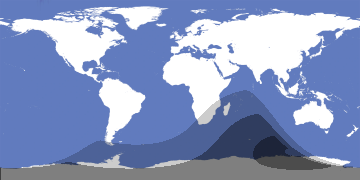
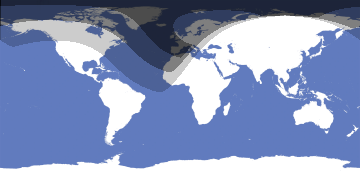
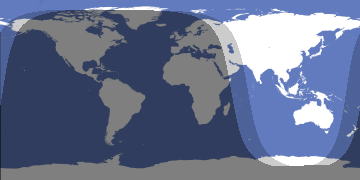
Solar Passage Through Day
Double-click to unlock the map.
Current Sun position
| Time | 07:28 |
| Latitude | 37.3541 |
| Longitude | -121.955 |
| Sun elevation | 38° |
| Sun Azimuth | 93° |
Yearly Sunlight Dynamics
Sun Properties
| Date | Wed, 22 July 2026 |
| Twiglight begin | 19:29 |
| Twiglight end | 02:59 |
| Astrosession duration | 7h 29m |
| Elevation at transit | 73° |
| Transit time | 11:14 |
| Distance to Earth | 1.0159 AU (151,976,477 km) |
| Equatorial coordinates at midnight | RA: 08h 10m 15s", Dec: 20° 04' 14s |
| Constellation | Cancer |
Last and Upcoming Solar Eclipse
Tue, 17 February 2026
Hybrid Solar Eclipse
Global
93%
Local
-
| Global | From Your location | |
|---|---|---|
| Penumbra | 00:58-05:28 | Not Visible |
| Umbra | 02:43-03:44 | Not Visible |
Wed, 12 August 2026
Total Solar Eclipse
Global
100%
Local
-
| Global | From Your location | |
|---|---|---|
| Penumbra | 06:36-10:58 | Not Visible |
| Umbra | 07:59-09:36 | Not Visible |
Last and Upcoming Lunar Eclipse
Tue, 3 March 2026
Total Lunar Eclipse
Global
100%
Local
100%
| Global | From Your location | ||
|---|---|---|---|
| Penumbral | 23:46-05:24 | 23:46-05:24 | |
| Partial | 00:51-04:19 | 00:51-04:18 | |
| Total | 02:05-03:04 | 02:05-03:04 |
Fri, 28 August 2026
Partial Lunar Eclipse
Global
96.9%
Local
96.9%
| Global | From Your location | ||
|---|---|---|---|
| Penumbral | 16:26-22:02 | 17:35-22:02 | |
| Partial | 17:35-20:54 | 17:35-20:53 | |
| Total | - | - |
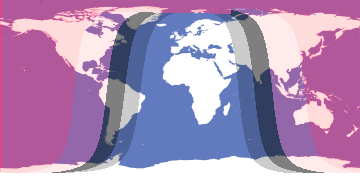
Aurora Activity
North
South


KP-index: . Very quiet geomagnetic activity
Aurora Probabilty on Your Location: 0%
Astrometric & Physical Parameters of Sun
Coordinates & Visibility
| Right Ascension | 8.17097° |
| Declination | 20.07064° |
| Magnitude | -26.7 |
| Constellation | Cancer |
| Elevation | 38° |
| Azimuth | 92.8° |
Basic Properties
| Mass, kg | 1.98841E+30 |
| Mean density, g/cm³ | 1.408 |
Rotation
| Sidereal rotation period, days | 25.38 d |
Surface & Atmosphere
| Surface gravity, m/s² | 274.0 m/s^2 |
| Escape velocity, km/s | 617.7 |
| Mean temperature, K | 5772 |
Data Acknowledgment
Our solar system data—including planetary physical and orbital parameters—comes from the Solar System OpenData API , maintained by Le Système Solaire. We thank Christophe and the contributors for making this open data available.