Sky Tonight
ST
Location settings
OH, US
40°/-83°
GMT -4
Waning22:19 - 04:50
🔎
☰
  • Tonight
    • Brightest Objects
  • Solar System
    • Sun
    • Moon
    • Planets
    • Mercury
    • Venus
    • Mars
    • Jupiter
    • Saturn
    • Satellite Flyovers
    • ISS
  • Small Bodies
    • Asteroids
    • Comets
  • Stars
    • Brightest Stars
  • Meteor Showers
    • Active Meteor Showers
    • Major Meteor Showers
  • Solar Eclipses
    • Future Solar Eclipses
    • Past Solar Eclipses
  • Lunar Eclipses
    • Future Lunar Eclipses
    • Past Lunar Eclipses
  • Deep Sky Objects
    • Summer Nebulae
    • Messier Objects
    • Nebulae
    • Star Clusters
    • Galaxies
  • Double Stars
    • Naked-Eye
    • Binocular
    • Physical
    • Color-Contrasting
    • Triple Star Systems
    • Multiple Star Systems
  • Constellations
    • Visible Tonight
    • Seasonal
    • Ecliptic
    • All 88 Constellations
  • Maps
    • Lunar map
    • Mars map
    • Mercury map
    • Eatrh
    • Cloud Cover Map
    • Aurora Activity
  • Contact Us
    • Feedback

Observation Settings

Or select it on the map:
This Earth map fragment is intended to illustrate celestial motion across the sky, emphasizing both bearing and elevational perspectives. The map's center point corresponds to the transit, showcasing celestial objects at their highest point, while elevation gradually decreases towards the map edges. This dynamic representation offers insights into the changing positions of celestial bodies with a focus on their bearing and elevational trajectories.
Your location: Columbus, United States
Timezone:
Latitude:
39.9625
Longitude:
-83.0061

Real-Time Aurora Activity

Discover the likelihood of witnessing the Northern or Southern Lights from your location.

The aurora borealis (Northern Lights) and aurora australis (Southern Lights) are beautiful natural phenomena caused by solar particles colliding with Earth's atmosphere. This page provides the current probability of auroral activity based on real-time space weather data.

North

South

KP-Index: 4.33

Aurora Visibility at Your Location

Double-click to unlock the map.

Your Coordinates: Lat: 39.9625°, Lon: -83.0061°

Aurora Probability Now: 5%

Visibility Status: Very low probability of aurora visibility. Likely no aurora.

Solar Wind Conditions

Solar Wind Speed: 602.3 km/s

Solar Wind Density: 6.94 protons/cm³

Bz Component (IMF Z-axis): -3.20 nT (Southward)

Last Update: 2025-06-25 18:32

The Bz component measures the north-south orientation of the Interplanetary Magnetic Field (IMF), a key part of the solar wind’s magnetic field. Its value is given in nanoteslas (nT).
- When Bz is negative (e.g., -6.3 nT), the IMF points southward. This southward orientation allows solar wind energy to more effectively enter Earth’s magnetic field, often leading to stronger auroral activity.
- When Bz is positive (e.g., +4.2 nT), the IMF points northward. A northward orientation typically suppresses the energy transfer, reducing the chance of visible auroras.
Example: If the Bz component is -6.3 nT, the IMF is southward, creating favorable conditions for auroras.

Global KP Index Forecast (Tue, 17 June 2025 – Fri, 27 June 2025)

KP-index 0 5 10

The Kp index measures geomagnetic activity on a scale from 0 (quiet) to 9 (extreme storm). This chart presents both recent observations and forecasted Kp values from 17 June, 20:00 through 27 June, 20:00, helping you monitor geomagnetic trends and anticipate periods of increased auroral activity.

Bz (IMF Component)

Bz -10 0 10
The Bz component of the Interplanetary Magnetic Field (IMF) indicates the north-south orientation of the magnetic field carried by the solar wind. Negative Bz values can connect with Earth's magnetic field, potentially triggering geomagnetic storms. Monitoring Bz helps predict space weather impacts on Earth.

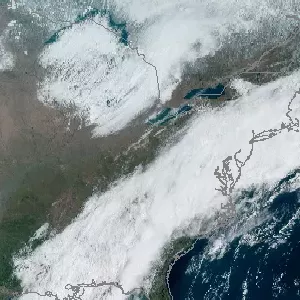
Real-Time Satellite Cloud Cover

Real-time satellite imagery helps determine where skies are clear for aurora viewing. Use this map to check cloud conditions across regions of potential auroral activity.

Real-Time Cloud Cover

View cloud cover timeline →

Credits and Unknowledgements

Aurora data is sourced from the NOAA Space Weather Prediction Center (SWPC).

We acknowledge the invaluable contributions of NOAA and its researchers in collecting, processing, and publishing aurora-related data.

All interpretations, errors, or omissions in the presentation of this data are our own, and NOAA is not responsible for any conclusions drawn from its use here.