Auriga Constellation
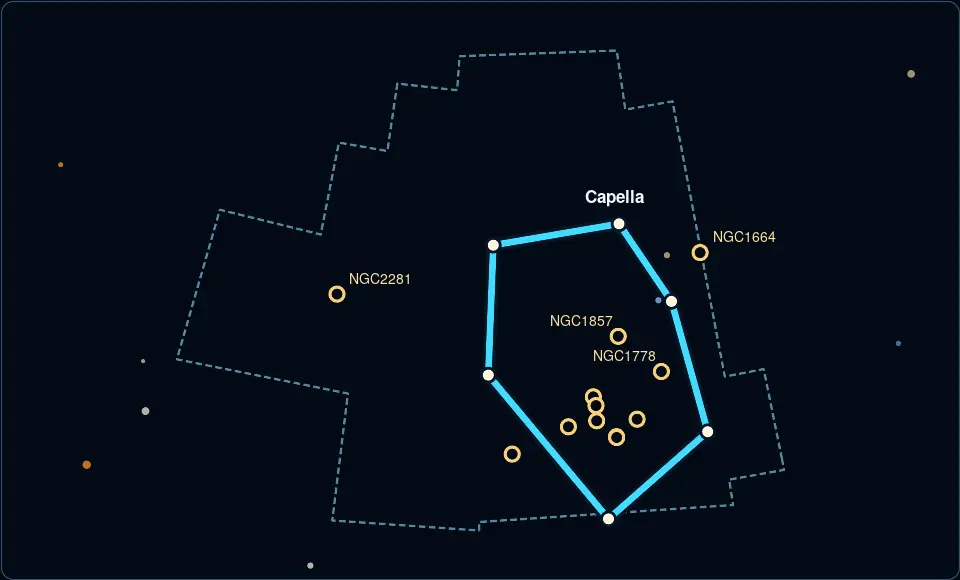
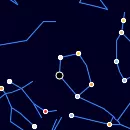
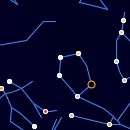
Auriga, the charioteer, is a constellation in the northern sky with the bright star Capella, one of the brightest stars visible from Earth.
Where is Auriga right now?
The center of the constellation is currently 75° above the horizon toward the north-west.
Auriga Rise and Set Timetable
| Time | Elevation | |
Moonrise, 71.9% illuminated 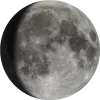 | 14:01 | -10° |
| Auriga rise | 18:03 | |
| Moonset | 01:36 | 75° |
| Auriga transit | 02:52 | 86° |
| Astronomical observing session begins | 04:09 | 75° |
| Astronomical observing session ends | 04:25 | 71° |
| Civil sunrise | 04:56 | 66° |
| Sunrise | 05:24 | 61° |
Track Auriga position throughout the night
← 22 October 2026 →
| Time | |
| Altitude | |
| Azimuth |
Shift the map to change the time and observe Auriga changing position in the night sky.
Annual motion of Auriga
| Date | Fri, 23 October 2026 |
| Twilight start | 17:44 |
| Twilight end | 03:49 |
| Twilight duration | 10h 6m |
| Rise | 17:59 |
| Set | 11:36 |
| Elevation at transit | 86° |
| Transit time | 02:48 |
| Equatorial coordinates | RA: 05h 47m 55s", Dec: 41° 32' 16s |
Deep-sky objects in Auriga
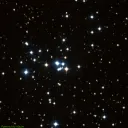
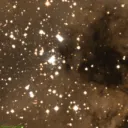
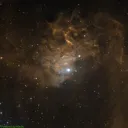
M37
Open Cluster
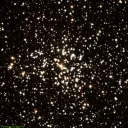
A rich open star cluster containing over 500 stars, located approximately 4,500 light-years away in the constellation Auriga.
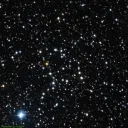
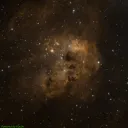
M36
Open Cluster
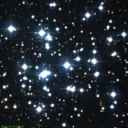
An open star cluster containing over 60 stars, visible to the naked eye under dark skies, located approximately 4,100 light-years away in the constellation Auriga.
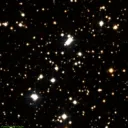
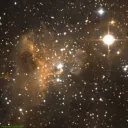
M38
Open Cluster
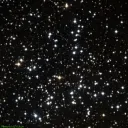
An open star cluster containing over 100 stars, located approximately 4,200 light-years away in the constellation Auriga.
Bright stars in Auriga
Capella
Star
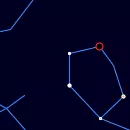
Capella, the sixth brightest star, is a yellow giant located in the constellation Auriga. Its brightness and close proximity to the celestial north pole make it easily identifiable.
Menkalinan
Star
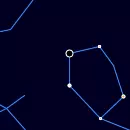
Menkalinan, also known as Beta Aurigae, is a bright star in the constellation Auriga. It is one of the brightest stars in Auriga and serves as a navigational marker for astronomers.