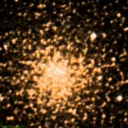
Serpens2 Constellation
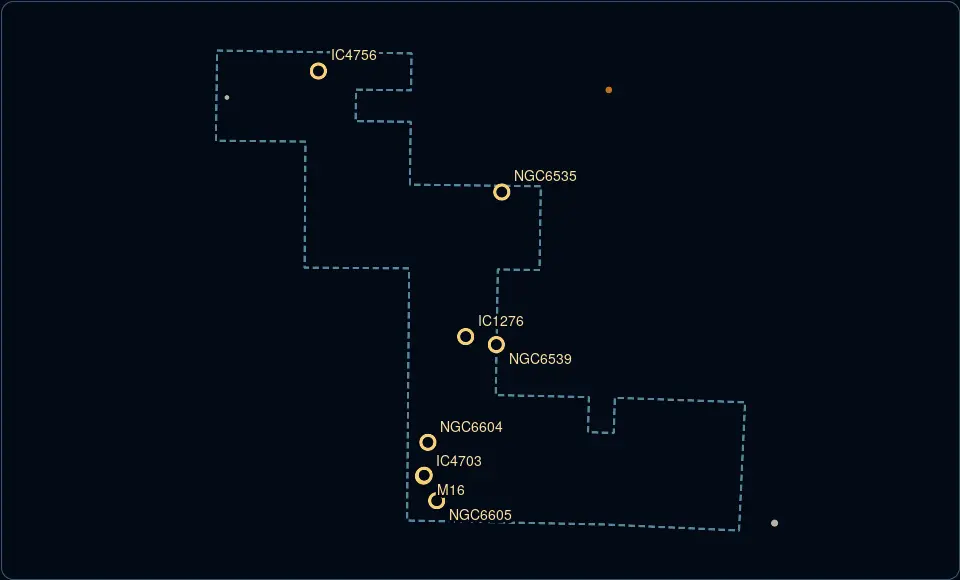
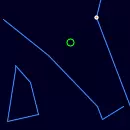
Serpens Cauda, the tail of the serpent, is the part of the Serpens constellation representing the tail of the serpent, located near the constellation Ophiuchus.
Where is Serpens2 right now?
It is currently below the horizon and is not visible from your location.
Serpens2 Rise and Set Timetable
| Time | Elevation | |
| Serpens2 transit | 15:07 | 49° |
Moonrise, 98.1% illuminated  | 15:17 | 49° |
| Sunset | 16:17 | 46° |
| Civil sunset | 16:45 | 43° |
| Twilight start (−12°) | 17:15 | 39° |
| Serpens2 set | 20:55 | |
| Astronomical observing session begins | 01:46 | -52° |
| Astronomical observing session ends | 04:28 | -51° |
| Moonset | 04:57 | -47° |
| Serpens2 rise | 09:14 |
Track Serpens2 position throughout the night
← 25 October 2026 →
| Time | |
| Altitude | |
| Azimuth |
Shift the map to change the time and observe Serpens2 changing position in the night sky.
Annual motion of Serpens2
| Date | Mon, 26 October 2026 |
| Twilight start | 17:40 |
| Twilight end | 03:52 |
| Twilight duration | 10h 12m |
| Rise | 09:14 |
| Set | 20:52 |
| Elevation at transit | 49° |
| Transit time | 15:03 |
| Equatorial coordinates | RA: 18h 13m 12s", Dec: -3° 26' 02s |
Deep-sky objects in Serpens2

Eagle Nebula (IC4703)
Nebula
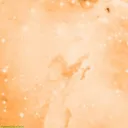
IC4703 is a nebula with apparent magnitude 6.00 in the constellation Serpens2, spanning approximately 5.1 arcseconds in the sky.
M16
Nebula
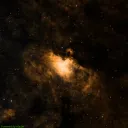
The Eagle Nebula, a young star cluster and emission nebula, known for its 'Pillars of Creation' photographed by the Hubble Space Telescope.