
IC1613 Position and Visibility Tonight
Where is IC1613 right now?
Twilight begins at 22:49 local time, and at that moment, IC1613 will appear at an altitude of 13 degrees toward the east.
IC1613 Visibility on July 27
IC1613 Rise and Set Timetable
| Time | Elevation | |
Moon Rise, 93.7% illuminated  | 16:49 | -48° |
| Astrosession begin | 20:04 | -20° |
| IC1613 rise | 21:46 | |
| Moon Set | 02:03 | 47° |
| Astrosession end | 02:24 | 49° |
| Twighlight end | 03:03 | 53° |
| Civil sunrise | 03:39 | 55° |
| IC1613 transit | 03:51 | 55° |
| Sunrise | 04:09 | 55° |
| IC1613 set | 09:57 |
Track IC1613 Position Throughout the Night
← Mon, 27 July 2026 →
| Time | |
| Altitude | |
| Azimuth |
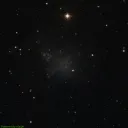
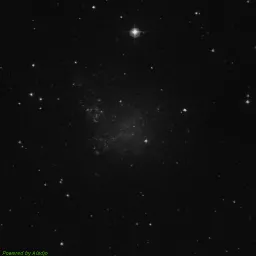
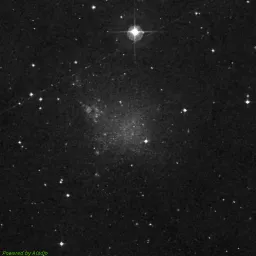
IC1613 Image Gallery
DSS Blue
DSS Red
DSS Near-Infrared
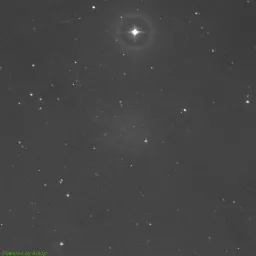
DSS Composite image
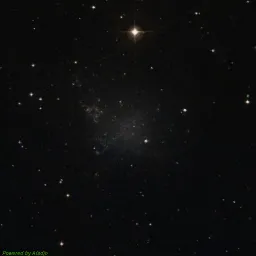
The photos are taken from the Digitized Sky Survey 2 (DSS2), which was produced at the Space Telescope Science Institute (STScI) under NASA contract, using data from the UK Science and Technology Facilities Council (STFC), the European Southern Observatory (ESO), and the National Geographic Society-Palomar Observatory Sky Survey (POSS II).
Special thanks to the National Optical Astronomy Observatory (NOAO), the Royal Observatory, Edinburgh, and the California Institute of Technology for their significant contributions.
Finder Chart for IC1613
| Object name | IC1613 |
| Field of view | |
| Limiting magnitude | |
| IC1613 coordinates | 1.07994, 2.11778 |
| Center coordinates | 1.07994, 2.11778 |
IC1613 Passage Through Night
Current position of IC1613
| Time | 22:49 |
| Latitude | 37.3541 |
| Longitude | -121.955 |
| IC1613 elevation | 13° |
| IC1613 Azimuth | 97° |
Annual motion of IC1613
IC1613 will be visible until February, 20, when it will move too close to the Sun. During this time, its proximity to the Sun will cause it to disappear from the night sky, making it unobservable for a while.
| Date | Tue, 28 July 2026 |
| Twighlight start | 20:03 |
| Twighlight end | 02:22 |
| Twighlight duration | 6h 20m |
| Rise | 21:42 |
| Set | 09:53 |
| Elevation at transit | 55° |
| Transit time | 03:47 |
| Equatorial coordinates | RA: 01h 04m 47s", Dec: 02° 07' 04s |
| Magnitude | 10 |
| Constellation | Cetus |
The graph is structured with the vertical axis showing the hours of the day, ranging from 12 AM to 12 AM the next day, while the horizontal axis spans each day of the year.
The reddish shaded area indicates the periods when the IC1613 is above the horizon, visible to observers. The white line marks the times when the celestial object reaches its highest point in the sky each day, known as the transit.
You can also view detailed visibility information in a dedicated table, including exact rise, transit, and set times for each date.
Astrometric & Physical Parameters of IC1613
Coordinates & Visibility
| Right Ascension | 1.07994° |
| Declination | 2.11778° |
| Magnitude | 9.54 |
| Constellation | Cetus |
| Elevation | 12.5° |
| Azimuth | 97° |
Data Credits
The nebulae information on this page is sourced from the OpenNGC project, developed by Matteo Verga. OpenNGC provides detailed data on the NGC catalog, which is a valuable resource for exploring deep-sky objects such as nebulae.
For more details or to contribute to OpenNGC, visit the official GitHub repository: OpenNGC on GitHub.