
Izar Position and Visibility Tonight

Where is Izar right now?
Izar is located in the constellation Bootes. At the current time, it is below the horizon and not visible from your location.
Twilight begins at 19:34 local time, and at that moment, Izar will appear at an altitude of 69 degrees toward the southwest.
Twilight begins at 19:34 local time, and at that moment, Izar will appear at an altitude of 69 degrees toward the southwest.
Izar Visibility on July 18
Izar is visible from sunset through most of the night
Izar Rise and Set Timetable
| Time | Elevation | |
Moon Rise, 9.3% illuminated 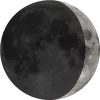 | 07:47 | -22° |
| Izar transit | 18:09 | 80° |
| Sunset | 18:25 | 79° |
| Civil sunset | 18:57 | 76° |
| Twighlight start | 19:34 | 69° |
| Astrosession begin | 20:14 | 62° |
| Moon Set | 20:45 | 56° |
| Izar set | 01:39 | |
| Astrosession end | 02:13 | -5° |
| Izar rise | 10:34 |
Track Izar Position Throughout the Night
← Sat, 18 July 2026 →
| Time | |
| Altitude | |
| Azimuth |
Shift the map to change the time and observe Izar changing position in the night sky.
Finder Chart for Izar
Double-click to unlock the map.
| Object name | Izar |
| Field of view | |
| Limiting magnitude | |
| Izar coordinates | 14.749784, 27.074222 |
| Center coordinates | 14.749784, 27.074222 |
Izar Passage Through Night
Double-click to unlock the map.
Current position of Izar
| Time | 06:56 |
| Latitude | 37.3541 |
| Longitude | -121.955 |
| Izar elevation | -25° |
| Izar Azimuth | 11° |
Here you can see the current position of the Izar on the map, as well as its positions for rise and set. This tool allows you to track the Izar's movement throughout the night, providing you with accurate and up-to-date information.
Annual motion of Izar
Izar will be visible until October, 6, when it will move too close to the Sun. During this time, its proximity to the Sun will cause it to disappear from the night sky, making it unobservable for a while.
| Date | Sat, 18 July 2026 |
| Twighlight start | 20:10 |
| Twighlight end | 02:07 |
| Twighlight duration | 6h 57m |
| Rise | 10:34 |
| Set | 01:35 |
| Elevation at transit | 80° |
| Transit time | 18:05 |
| Equatorial coordinates | RA: 14h 44m 59s", Dec: 27° 04' 27s |
| Magnitude | 2 |
| Constellation | Bootes |
The graph illustrates the annual visibility pattern of a Izar, providing a comprehensive overview of its daily appearances and transit times throughout the year.
The graph is structured with the vertical axis showing the hours of the day, ranging from 12 AM to 12 AM the next day, while the horizontal axis spans each day of the year.
The reddish shaded area indicates the periods when the Izar is above the horizon, visible to observers. The white line marks the times when the celestial object reaches its highest point in the sky each day, known as the transit.
You can also view detailed visibility information in a dedicated table, including exact rise, transit, and set times for each date.
Astrometric & Physical Parameters of Izar
Coordinates & Visibility
| Right Ascension | 14.749784° |
| Declination | 27.074222° |
| Magnitude | 2.35 |
| Constellation | Bootes |
| Elevation | -24.7° |
| Azimuth | 11.1° |