Corona Borealis Constellation
Double-click to unlock the map.
Corona Borealis, the northern crown, is a small, semicircular constellation in the northern sky, representing the crown of Ariadne.
Corona Borealis Rise and Set Timetable
| Time | Elevation | |
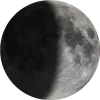
Moonrise, 21% illuminated ![]() | 09:49 | 4° |
| Corona Borealis transit | 17:11 | 84° |
| Sunset | 17:55 | 79° |
| Civil sunset | 18:24 | 74° |
| Astronomical observing session begins | 18:57 | 67° |
| Moonset | 20:26 | 50° |
| Corona Borealis set | 00:59 | |
| Astronomical observing session ends | 03:26 | -17° |
| Corona Borealis rise | 09:19 |
Track Corona Borealis Position Throughout the Night
← 18 August 2026 →
| Time | |
| Altitude | |
| Azimuth |
Shift the map to change the time and observe Corona Borealis changing position in the night sky.
Nebulae in the constellation Corona Borealis
IC1166
Galaxy Pair
IC1166 is a galaxy pair with apparent magnitude in the constellation Corona Borealis, spanning approximately 0.6 arcseconds in the sky.
NGC6076
Galaxy Pair
NGC6076 is a galaxy pair with apparent magnitude in the constellation Corona Borealis, spanning approximately 0.8 arcseconds in the sky.
NGC6089
Galaxy Pair
NGC6089 is a galaxy pair with apparent magnitude in the constellation Corona Borealis, spanning approximately 1.1 arcseconds in the sky.
Annual motion of Corona Borealis
| Date | Tue, 18 August 2026 |
| Twilight start | 19:28 |
| Twilight end | 02:44 |
| Twilight duration | 7h 17m |
| Rise | 09:19 |
| Set | 00:56 |
| Elevation at transit | 84° |
| Transit time | 17:07 |
| Equatorial coordinates | RA: 15h 49m 45s", Dec: 31° 04' 06s |
| Magnitude | - |
| Constellation |
The graph illustrates the constellation’s annual visibility pattern and its daily rise, set, and transit times throughout the year.
The vertical axis shows the hours of the day, while the horizontal axis spans the days of the year.
The reddish area marks when the constellation is above the horizon. The white line shows when it reaches its highest point in the sky. View detailed visibility information in a table with rise, transit, and set times for each date.
The vertical axis shows the hours of the day, while the horizontal axis spans the days of the year.
The reddish area marks when the constellation is above the horizon. The white line shows when it reaches its highest point in the sky. View detailed visibility information in a table with rise, transit, and set times for each date.
Acknowledgements
We gratefully acknowledge the International Astronomical Union (IAU) for defining and standardizing the official constellation boundaries used in celestial mapping.
Special thanks to Sky & Telescope Magazine and contributors Roger Sinnott and Rick Fienberg for producing the charts and tables. Alan MacRobert’s constellation patterns were influenced by the work of H. A. Rey and adjusted to align with earlier traditions.